
Throughout August, the Club Penguin Armies conducted the CPA Census and collected the results. Since then, the data taken from all the questions has been analysed and put in graphs. The long-awaited results are now presented to the community.

Designed by Alucard
A Club Penguin Armies Census Rewind
Importance of Census Existence
Having a census that covers the whole community is very important. This way, the members of the community can be aware of the landscape of the community. Whether that is the year most people joined armies, or what is the most popular timezone, or any other of the questions asked. It can boost or weaken the argument of using EST as the main community-wide timezone for Club Penguin armies.
From the organisation’s side, we can take specific actions based on the demographics. For example, since the majority of the community is Christian, as it will be analysed later, Christmas could be set as a day off. All data also show the diversity that exists in the Club Penguin armies community, with people in the community having different races, sexualities, or religions, for example.
Having a census every few years can be helpful to figure out how the community has developed over that time. For example, through the data collected over the years, we can see that the average age is ever-increasing and we can pinpoint how much the increase is. It can also show the difference in the armies’ popularity, which army is the most popular over the years. The community’s participation in the census is critical, along with the organisation’s obligation to host the census as well as they can and provide the results.
Uncharted Territories
The first-ever community-wide census organised by a Club Penguin army league happened in 2011 under Club Penguin Army Central, with the result post being written by Bluesokwa2. While there are references about a census happening even earlier, conducted by armies at that time, it is said that it only contained very few armies, so it covered a tiny part of the community.
2011
The 2011 census, organised by Bluesokwa2 and KingFunks only covered some very basic information. It worked by people commenting their responses under a post. They provided info regarding when they joined Club Penguin Armies, their timezone and their army. Notably, the most common time zone was EST followed by CST and then GMT. There were only 15 people who chose a timezone outside of the Americas or the GMT. The most popular army was the Army of Club Penguin, followed much behind by Ninjas and Nachos, while most people chose the “Other” option. That census managed to get around 180 responses, making it a notable attempt at providing info about the community landscape.
2014
In an attempt to get more detailed, updated results, KingFunks and Bluesokwa1 launched a new census in 2014, which resembles the recent census more. That one was completed through forms and it also included the collaboration of both CPAC and Small Medium Army Press, with both organisations co-hosting it. This helped them receive more responses, reaching almost 400 in the main form and 245 in the optional one.
Outside of the original questions, people were asked to answer when they joined Club Penguin, how they were recruited and what their first army was. In addition to that, there was an extra optional form to understand the community status better. It included questions about the people’s gender, age, race, sexual orientation, religion and political ideology. This time, ACP was the most popular army again, followed by the Nachos and Ice Warriors.
2020
In 2020, the Club Penguin Army Hub was the first organisation to bring back the census in the CPPS era, organised by the administrators Cassie, Pookie437, LuciferStar and Max. That was the census with the most responses, given the large growth of the community during the COVID era, with some questions reaching up to 415 responses, as the census results posts claims. Unfortunately, the images can no longer be accessed, so there is a very limited amount of data that can be used from it. It was also the first census in which ACP got dethroned from being the most popular, with the Rebel Penguin Federation taking its place.
2023
The first Club Penguin Armies census happened in 2023 under Mchappy‘s, Wynn‘s and Disha‘s administration. It contained the same questions as the 2014 one, so that it can be compared with it, apart from the religion one. As it is the second most recent census, its results will be used a lot to compare 2023 and 2025, in order to figure out what has changed, if anything. That census gathered around 275 responses in the main form and 160 in the optional one, which is a respectable number and a good sample, given the community stagnation of that time.
The current census
This year, in August, the second CPA census took place. The results were expected to be released much earlier, but recent events and the need to address them pushed it back. It contained a single form with the same mandatory main questions as 2023, with the addition of the question regarding the state of CPA as a whole. It also had an optional part with the same question, with the addition of the religion question. This allows us to compare most of the answers with the previous census results. Also, notice that all censuses apart from the 2020 one happened during the summer.
The census got 310 responses in the main part, covering a large part of the community and 245-290, depending on the question, in the optional part. This means the demographics of the community were better mapped this time, as over 90% of the responders also answered most optional questions as well.
Without further ado, it is time to show the data analysis of this year’s census and the community trends over the years.
Data Analysis
Required Questions
When did you join Club Penguin?
This was the first question of the census, with 310 people answering it, the same as the following ones of the required part of the form.
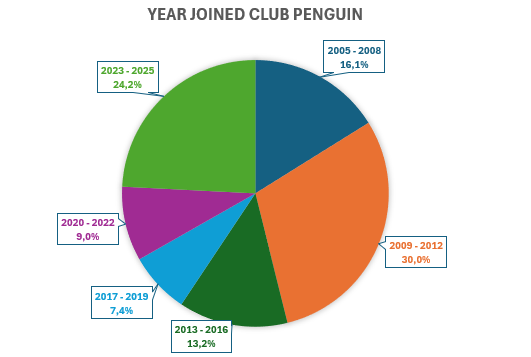
Chart 1: When did the participants first played Club Penguin
From the graph, it is visible that the most popular choice was 2009-2012. This makes sense as Club Penguin was at its peak and had the most active playerbase around that time. There is an increase on the members who joined at that time, given that the percentage is now 30% compared to the 21.2% of the previous census. Interestingly enough, the same group contained 34% of the people in the 2014 census. This shows that people who joined at that time have stuck around over time.
The second most popular group of the current census is the 2023-2025 one which shows the large recruiting efforts of the armies and their ability to bring new people in and renew the community even 7 years after Club Penguin’s death. The third most popular choice, being 2005-2008 further shows the intense member retention of the Club Penguin community.
The most popular group in the 2023 census was the 2012-2017 one, with 24.1%. While this group has been split in the current census between the 2013-2016 and 2017-2019 groups, it has still faced a large decline.
When did you join armies?
Moving forward, the second question of the census aimed at discovering the trend of people joining our community.
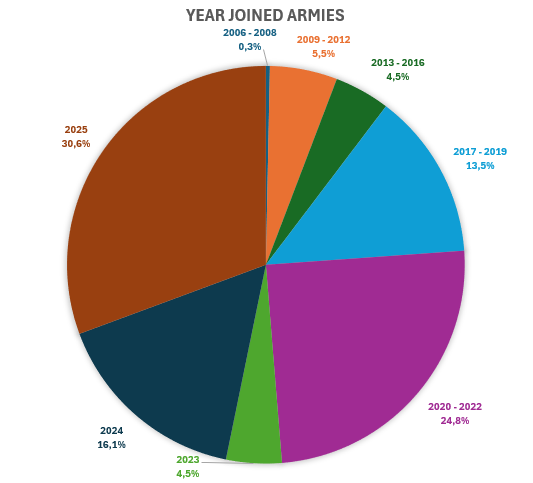
Chart 2: When did the participants first joined armies
From the chart we can take out much information. The most popular category is 2025, with a large percentage of people also joining in 2024, showing again the armies’ recruiting efforts. 30,6% of the people who completed the census joined this year and 16.1% the previous one.
In total, 51.2% of the people joined the community in the past 3 years. 24.8% joined during or shortly after the COVID era, 2020-2022, which was the second most popular choice. 13.5% joined right after the Club Penguin shutdown.
11.3% of the community experienced the original Club Penguin armies era, 4.5% of whom joined after 2013 and 5.5% between 2009-2012 with barely anyone joining before 2009. This shows that the active members of the community are mainly new, but some people have been around for a long time.
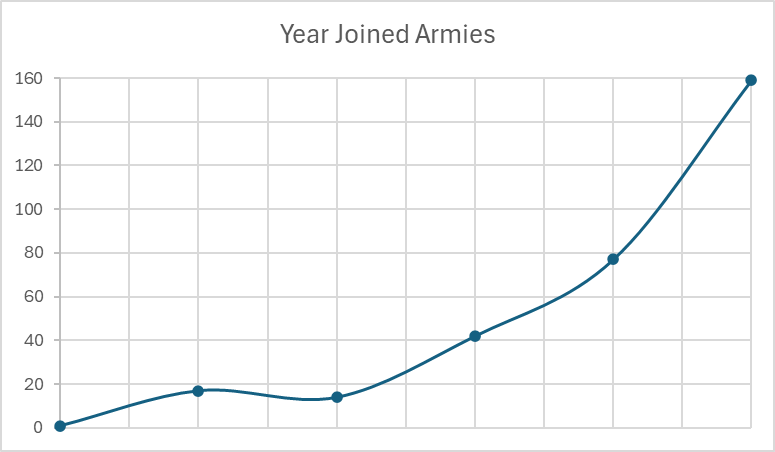
Chart 3: A different graph showing the joining trend
Above, there is a graph to better visualise the joining trends. 2023-2025 have been put in the same category, so that each post Club Penguin category contains 3 years while the original Club Penguin categories have 3. The y-axis is the number of people, the x-axis is based on the option each number of people chose. Starting from 2006-2008 to 2023-2025.
To put the numbers into perspective, in 2023, 41.6% had joined in the past 3 years, with the same % being 34% in 2014 and 71% in 2011. This shows that the community is growing at a good rate, better than most times before.
How were you recruited?
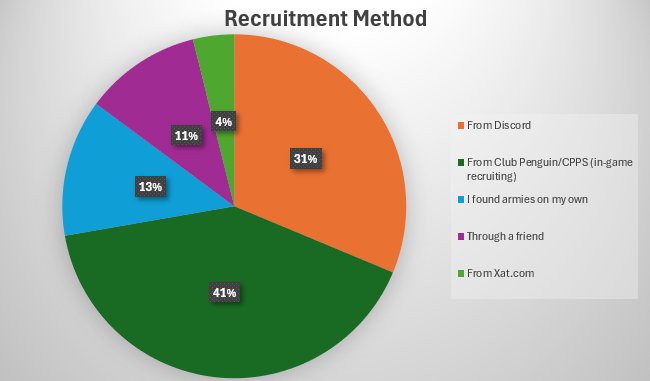
Chart 4: Recruiting Methods
The most popular category was in-game recruiting, with 41%. The second most popular was Discord recruiting with 31.3%. Following that, the % of people who found armies on their own was 12.9%, and 11% joined through a friend who was already a member. Only 3.9% joined from Xat.com, which makes sense given the current state of the website.
The results are almost the same as 2023, with Club Penguin/CPPS recruiting gaining more popularity and Discord losing some, probably because of the larger armies’ use of CPPS. In the 2014 census, half of the people joined through Club Penguin, with 1/3 of the community at the time finding armies on their own. This shows that armies are tougher to find now, compared to then, partially because of the Club Penguin shutdown, among other reasons.
What was your first army?
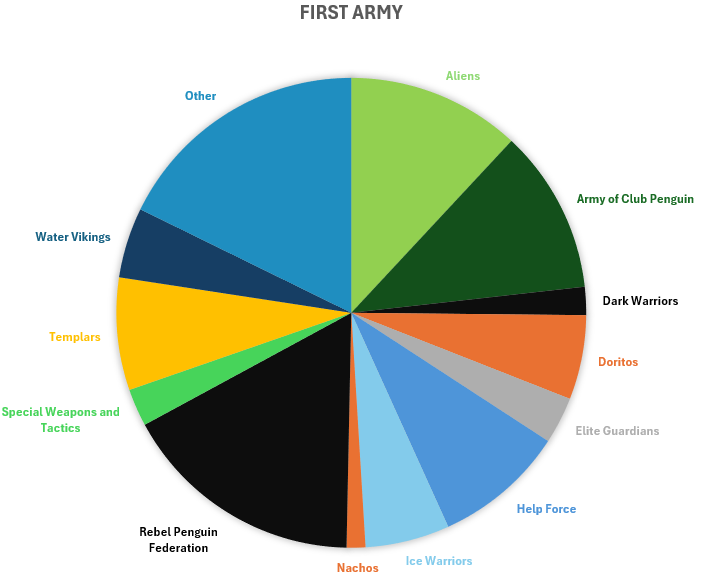
Chart 5: First army of the census responders
From this chart, we can see that the most popular option was the “Other” option, which gathered 17.7%. Apart from it, most people’s first army was the Rebel Penguin Federation with 16.8%. It was followed by the Aliens with 11.9% and the Army of Club Penguin with 11.3%.
The other armies received less than 10% with the Help Force having 9%, the Templars 7.7%, the Doritos and the Ice Warriors both having 5.8%. The other armies had less than 5%.
There is a difference compared to 2023, with the “Other” option overcoming RPF this time. In addition, Aliens, who were not even an option in 2023, now receive 11.9%. ACP has remained in the same place. It was behind IW at that time, which has now dropped.
In 2014, ACP was the most popular first army with over a quarter of the community having started their journey there at that point. It was followed by the “Other” option and then IW, Nachos, who were tied, RPF.
What is your main army?
This is one of the most interesting questions, as it can give an indication regarding which armies are the largest in numbers and activity.
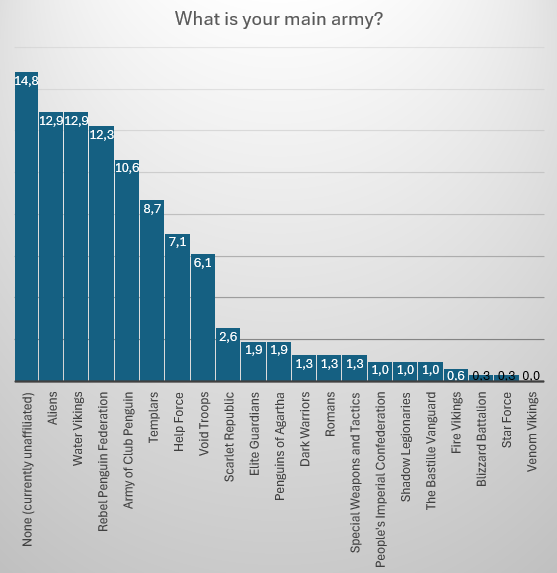
Chart 6: Main army of the census responders
Surprisingly, the most popular choice was “None” with 14.8%. The same choice received a similar percentage in 2023 when it was first once again. It didn’t even exist in the 2014 census and received less than 3% in 2011. In 2020, the Rebel Penguin Federation was the most popular, while in the 2014 and 2011 census, the Army of Club Penguin received first place.
The Aliens and the Water Vikings came second this time, with the same number of people choosing them. In 2023, the Water Vikings were third, while Aliens weren’t even a choice. Behind those two, it was RPF and ACP, while they were fourth and second in 2023, and fifth and first in 2014. Notably, the Elite Guardians of Club Penguin, who were tied in the fourth place with RPF in 2023 are now the tenth most popular army. At the same time, the recently revived Dark Warriors were twelfth in this census and fifth in the 2014 one. The Venom Vikings was the only army that wasn’t chosen by any responder.
It is worth mentioning that there were more options this year than 2023, with more armies being active. In 2014 there were less options too as that census contained the “Other” option.
What is your timezone?
This question can show the global composition of the community.
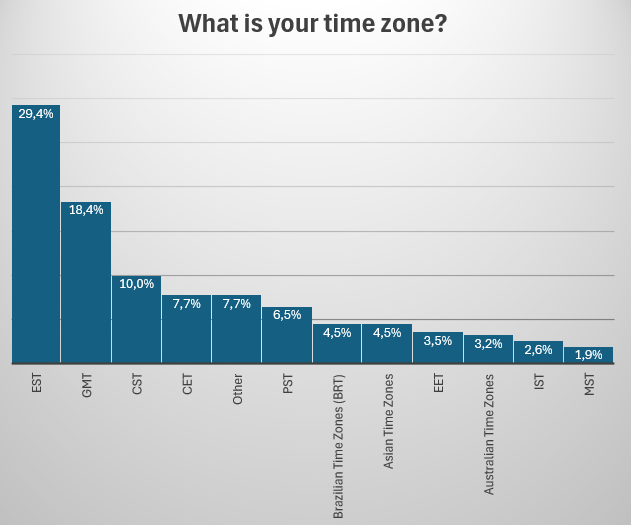
Chart 7: Timezone of the census responders
From the chart, we see that the most popular timezone is EST with 29.4% which has been the case with all censuses. In 2023, it received 32.1%, in 2014, 41% and in 2011, 37%. This shows that there has been a constant decline since 2014.
The second most popular timezone is GMT, getting 18.4%. In 2023, it received 20.4%, in 2014, 16%, while in 2011 it came third with 16%. It was followed by CST with 10%. CST had 7.7% in 2023, 7.7% was CST, in 2014 14% and in 2011 it was second with 21%.
In the current census, it is visible that most of the people live in specific areas. About 52.3% live in the Americas, both north and south. About 29.6% live in Europe or Africa. The rest 18.1% live in Asia, Oceania, or in more rare timezones of the previously mentioned continents.
How would you describe the current state of CPA?
The final question of the required part is one that had not been used in previous censuses. It asks the participant about their views regarding the whole community.
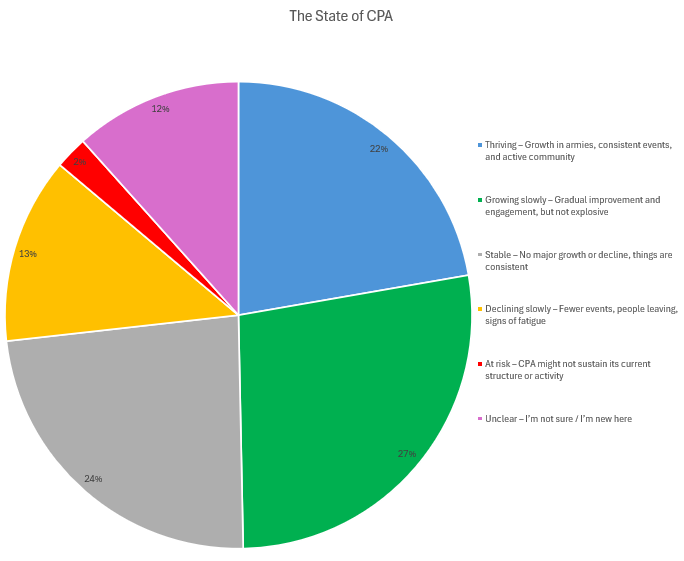
Chart 8: The State of CPA based on the responders
According to the results, 22.3% of those who completed the census believe that the community is thriving. 27.4% think it is growing slowly, while 12.9% believe it is stable, with things remaining consistent. 12.9% believe that the community is slowly declining, while 2.3% claim that the community is at risk and may not manage to survive. There was also an additional 11.6% who were unsure or joined the community very recently.
Removing the percentage of people who were not certain, we can get a new graph.
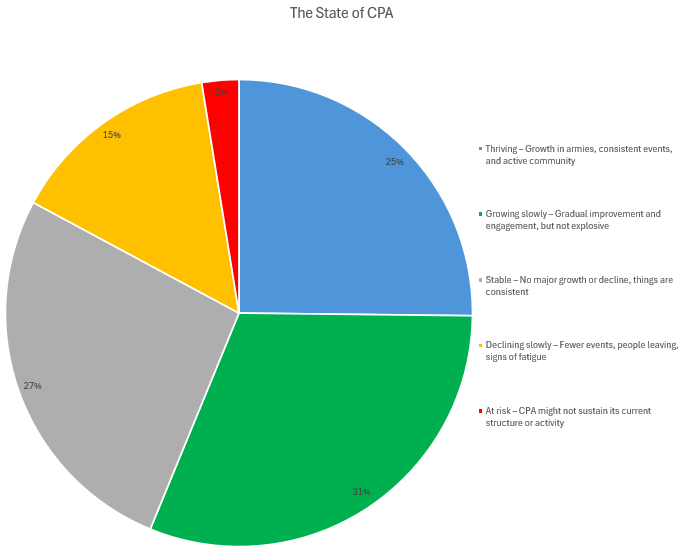
Chart 9: The results without the uncertain %
From the new chart, we see that over half of the responders believe that the community is growing, with one out of four believing that it is thriving. Almost 1 out of 3 believes that the community is growing gradually. Over one out of four believe that the community is steady, without any important change. Over 1 out of 7 believe that it is declining slowly, with barely anyone supporting that it is at risk.
Optional Questions
Below are the results of the optional questions. Optional questions are useful in the census to create a better view of the demographic of the community.
How old are you?
This was one of the most interesting parts of the census. Many people have tried to guess the average age of the community over time, but most of their estimations don’t match the census results. It should be noted that after seeing the percentage of people who were 21+ in 2023, we decided to add more options in this question. 265 out of the 310 people who took the census answered this question.
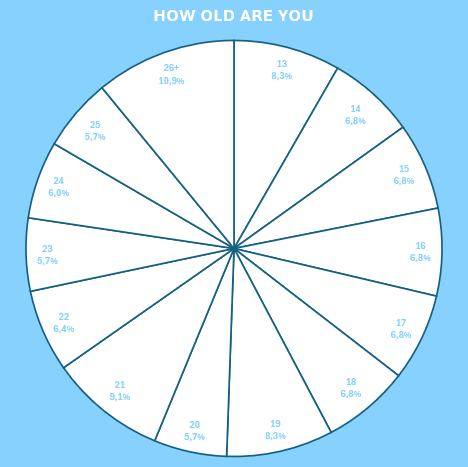
Chart 10: The age of the responders
The results of this question were the most surprising ones. Even after extending the single-year options up to 25, 26+ was the most popular one. In 2023, the most popular age category was 21+, with 28.6% of the responders being in it. This time, if there was a 21+ category, 43.8% would be in it.
In 2014, the most popular age group was 14, with 27%. The highest age available in that census was 18+, which had 5%. Today, 64.5% of the community, based on the results, are 18+. The same percentage in 2023, was around 53-55%, so there has been about a 10% increase.
Age Distribution
The median age based on the results is 19, while the average is between 19.6 and 20 years old. In 2023, the median age was 18 and in 2014 it was 14. Based on those 3 censuses, it is calculated that the median age increases by about 0.452 per year.
Interestingly, all choices got a similar percentage, which shows an even age distribution within the community. Aside the 26+ group, 21 was the 2nd most popular followed by 13 and 19. All age groups, aside from 26+ and 21, received around 6-8%. This can be better visualised through chart 11, which shows how many people chose each option.
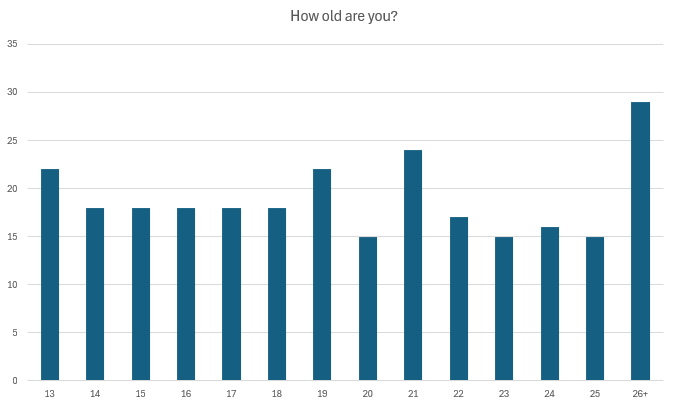
Chart 11: A 2nd chart with the ages of the responders
What is your gender?
This one was a simple question, with the choices in this census being Male, Female, or Other. 288 out of the 310 people answered.
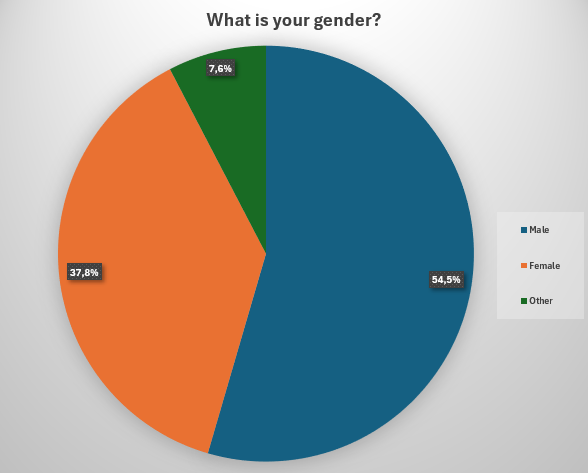
Chart 12: The responders’ gender
Similar to the 2014,2020,2023 censuses, the community is mainly made up of males. The number is lower than all the previous censuses, being 54.5%, having a 3.6% decline from 2023. At the same time, the female percentage has been increasing, reaching 37.8%. This is a 3% increase compared to 2023. It should be noted that in the 2014 census, 90% of the community were males and the rest 10% females, while there was no other option. With the community becoming more inclusive, the other option was introduced in 2020. In 2023 there were both the options of non-binary and other, which were merged this year. They received 7.1% compared to 7.6% now, seeing a 0.5% increase.
What is your race?
This is another question that has been used in all censuses. 276 out of the 310 people answered it this time.
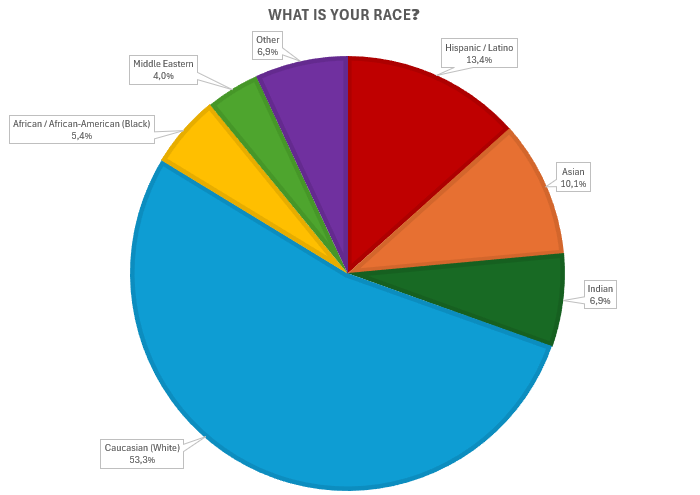
Chart 13: The responders’ race
Once again, we see the Caucasian race being first. This time, with 53.3%, 0.1% higher than the last time. Compared to 2014 though, it has dropped 15%. The second most popular race was Hispanic/Latino with 13.4%. It saw a 3.7% increase since the last census and a 5% compared to 2014. The third most popular was the Asian race with 10.1%. It had a large decrease of 12.6%, partially because the Indian race was added as well. Still, compared to 2014 it is 6% higher.
Following up next, Middle Easterns make up 6.9% of the responders, with a 1.1% increase since 2023 and a 5% since 2014. 5.4% of the community is African/African-Americans, with a significant 2.8% increase since 2023 and a 1% increase since 2014. Indians make up 4% of the community. Their race wasn’t added separately in the 2023 census, but was in 2014, when they received 7% more.
Lastly, the “Other” option received 6.9%, which is the highest from the 3 censuses.
What is your sexual orientation?
This is another question that has been in the 2023 and 2014 censuses as well. 280 out of the 310 people answered it.
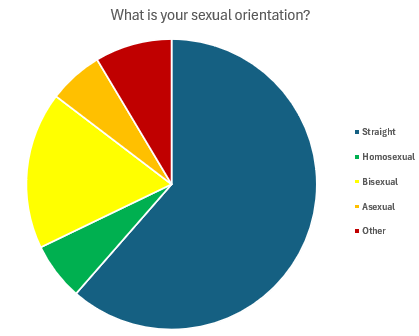
Chart 14: The responders’ sexual orientation
From the chart, we see that the majority of the community is straight. 61.4% of it to be specific. It has decreased by 0.8%, compared to 2023 and by 33% since 2014. This further shows the community being more accepting in the more recent years.
The second most common sexuality is bisexuality, with 17.5%, a 1.7% decrease since 2023. Homosexuals made up 6.4% of the responders in this census. In 2023, there was the “gay” and “lesbian” distinction, unlike this time, with the 2 options getting 9.6% at the time. In the 2014 census the “bisexual”, “gay” and “lesbian” choices were all combined and gathered 5%.
Asexuals had an increase, from 1% in 2014 to 3.8% in 2023 and 6.1% now. The “other” option received 8.6% compared to the 5.1% of the previous census.
How do you identify politically?
This was the second to last question. It was used in all three censuses discussed here. 245 people responded out of 310.
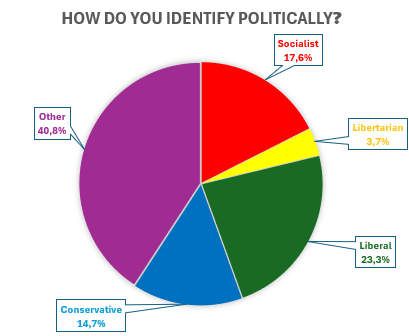
Chart 15: Political identity of the responders
From the chart we see that the most popular option was the “other” with 40.8%. It shows that the question needs to be edited for the future censuses and shows the large change in the political landscape. In the past, “other” received 23% in 2023 and 19% in 2014.
The second most popular were the Liberals with 23.3%. They decreased by 11.6% since 2023 and by 12% since 2014. They were followed by the Socialists, who lost 4.6% compared to 2023 and gained 3% since 2014. Next up were the Conservatives with 14.7%, a 2% drop since 2023 and 7% since 2014. Last of all, were the Libertarians with 3.7%, an increase of 1.3% compared to the previous census and a 5% decrease compared to the 2014 one.
What religion are you affiliated to?
This was the last question of the census. It wasn’t included in the 2023 one, but was in 2014. It was felt that it was necessary to bring it back, as there could be extra holidays being held if a religion acquired a significant percentage. 274 out of the 310 people voted.
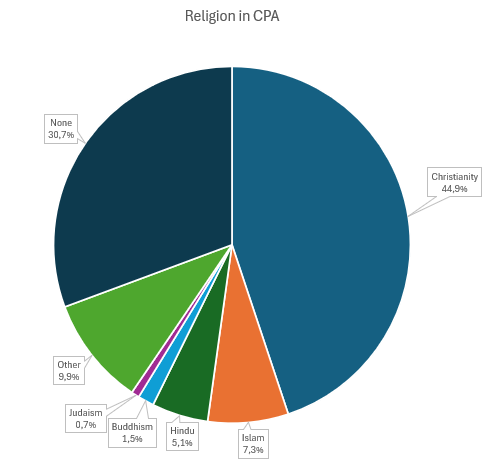
Chart 16: The responders’ religion
It is seen that Christianity is still the main religion of the community, with almost 45%, a 14% drop compared to 2014. It is followed by None, which got almost 31%, 6% higher than in 2014. The third most popular option was the “Other” option, getting 10%. It is 7% up from 2014, which shows that the community contains people from many different religions. Next are Islam and Hinduism, which show an increase compared to 2014. Last of all, are Buddhism and Judaism, which decreased from the 2014 census.
This sums up the data analysis. Club Penguin Armies would like to thank everyone who completed the census, especially those who filled up the optional questions too. You are an important part of the census, as well as the army leaders who shared it around and helped collect more data. This will stay forever in the CPA community history. We are glad to have gotten such a large sample size in both the required and optional questions. When it comes to history, through the analysis we have seen that the community has changed a lot over the years in some things, while remaining consistent in others. There is faith that the community is heading in the right direction. Hopefully, it pays off and the community grows larger and greater than ever.
What do you think of the census results? Did you expect them to look like that? What do you believe about the current CPA trend? How will the community look like during the next census? Let us know.

Edu14463 & Jojo Teri
Golden Age of CPA
More Information

Professional Club Penguin player
[…] CPA: Battleground. Currently, at a time when the community is in a much better state, as the census showed, several armies include at least one CPPS event in their weekly schedules. Notably, armies […]
[…] made its appearance along with custom rooms around the island. Apart from that, as seen from the census, most people are Christians, so they are most likely celebrating Christmas themselves too. Even for […]
[…] brought into armies from it. In comparison, when the current organisation Club Penguin Armies (CPA) hosted theirs earlier in the year — the difference is quite […]
[…] being brought into armies from it. In comparison, when the current organisation Club Penguin Armies hosted theirs earlier in the year — the difference is quite […]
[…] “Club Penguin Armies Census 2025: Results” Written by Edu14463 and Jojo Teri […]
[…] the Census of 2025, the “average” long-term member is somewhere between 23 and 28 years old, or even in the 30s. […]
[…] the 2025 Club Penguin Armies Census Results, Jojo Teri revealed the results of the latest census. Alongside this, he also mentioned past […]
[…] it has since become a tradition. With 38.6% of the community, more than one-third (based on the census) being part of the LGBTQ+, it only felt right to keep this tradition to give those people the […]